Caveman@piefed.social to 196@lemmy.blahaj.zoneEnglish · 4 months agoHeight Chartmedia.piefed.socialimagemessage-square38fedilinkarrow-up1206arrow-down16
arrow-up1200arrow-down1imageHeight Chartmedia.piefed.socialCaveman@piefed.social to 196@lemmy.blahaj.zoneEnglish · 4 months agomessage-square38fedilink
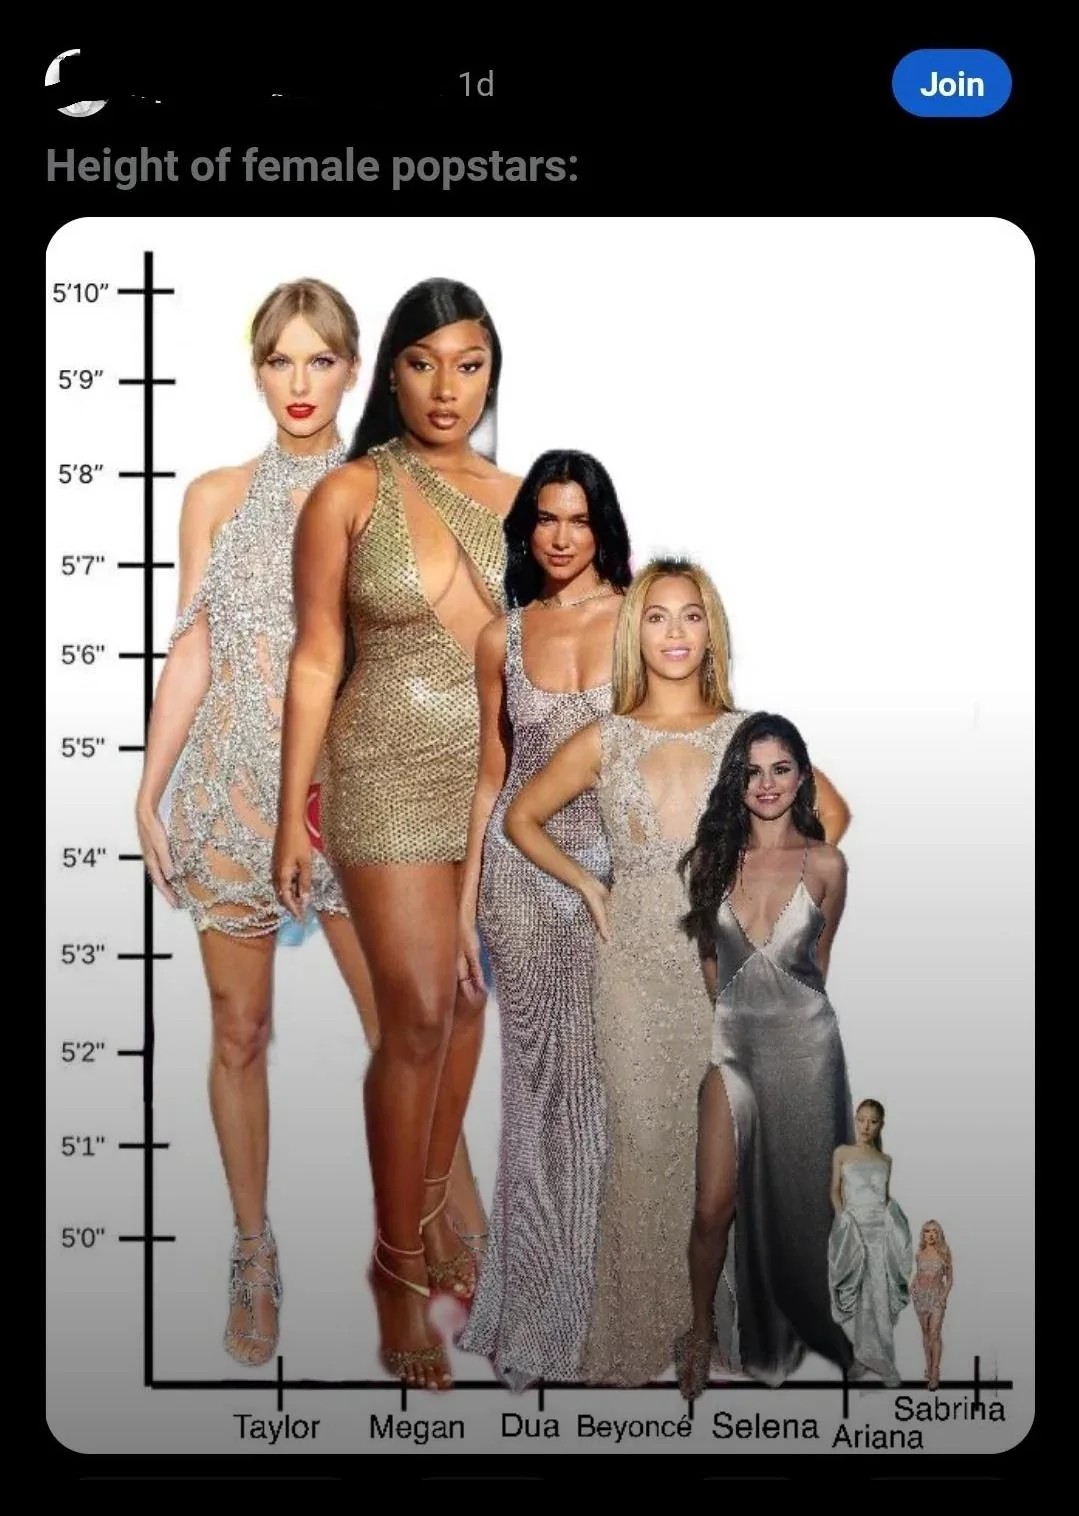
minus-squaretaiyang@lemmy.worldlinkfedilinkEnglisharrow-up11·edit-24 months agoHeights are potentially a good example of that. Iirc, the standard deviation of height is only about 3 inches (for women), so doing the full y-axis would make small differences between groups impossible to visually compare.
minus-squareChaoticNeutralCzech@feddit.orglinkfedilinkEnglisharrow-up1·3 months agoHow about a chart starting at 0, then cropping the bottom ¾ − not showing the full body but with heads in proportion?

Heights are potentially a good example of that. Iirc, the standard deviation of height is only about 3 inches (for women), so doing the full y-axis would make small differences between groups impossible to visually compare.
How about a chart starting at 0, then cropping the bottom ¾ − not showing the full body but with heads in proportion?